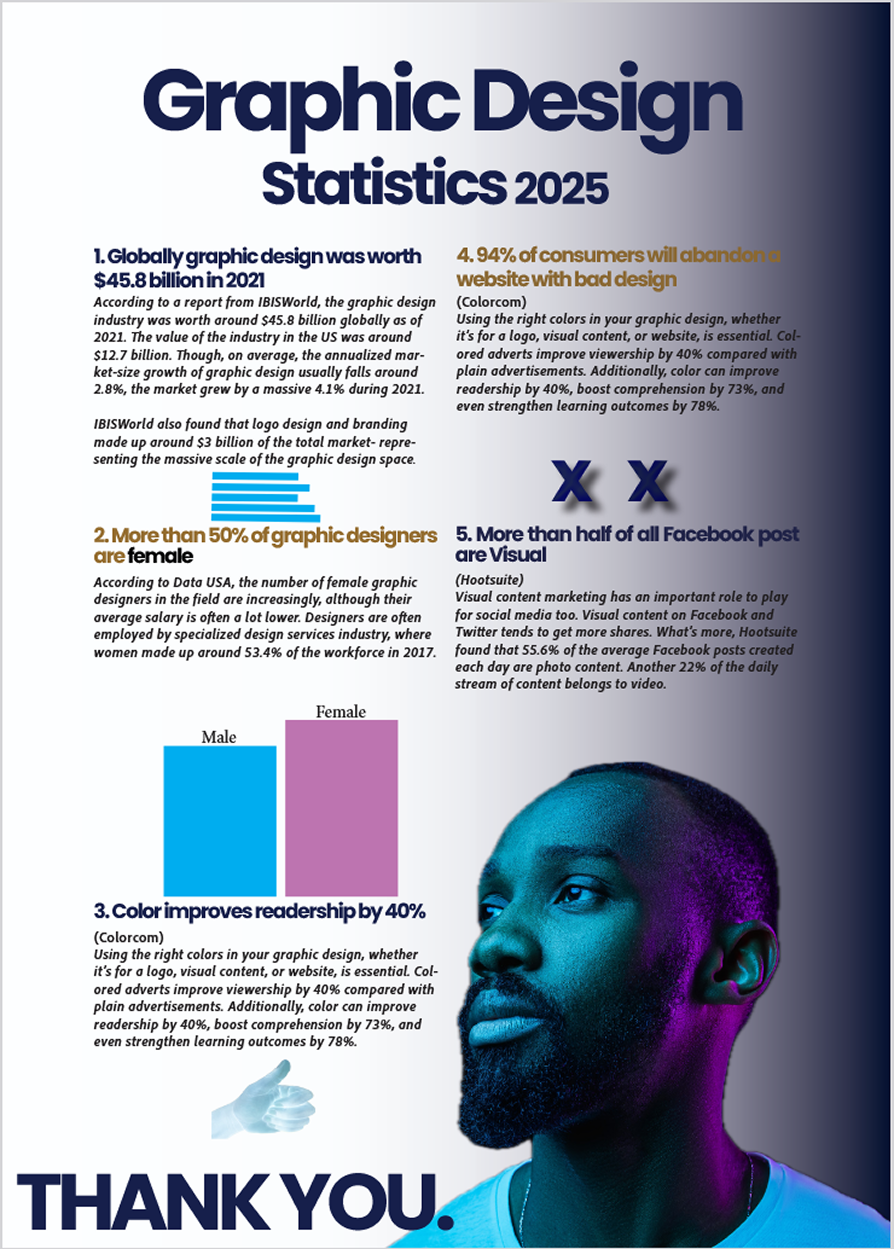
This infographic was designed in Adobe InDesign to showcase my understanding of visual hierarchy, balance, and structured layout. Using five data points from a graphic design statistics source, I translated complex information into clear, original visuals supported by minimal text for easy comprehension.
The project involved early ideation through thumbnail sketches, followed by the creation of custom graphics and a cohesive layout that guides the viewer’s eye. The final design demonstrates my ability to organize data visually while maintaining clarity, consistency, and strong typographic structure.